Disqualification - Operationalising the Opportunity Cost of Time
For (Product) it is essential to understand why customers are buying or not buying at what potential product shortcomings are. The problem is that most feedback is meaningless because it does not come from the target customer. The only why to ensure that within the sales process is disqualification.
A couple of years ago, I was at the SaaStr Annual, a software product conference. I started talking to a guy at a stand of a company that sold a software which helps companies handle different currencies. So, their product handle different currencies automatically in case you sold your product for US Dollars but needed to pay you employees in Euro.
After short small talk about how difficult it is to find hotels in San Francisco (where the conference was) the guy asked me a couple of questions:
How many people work in your company?
How much businesses do you do in other currencies?
What was your role in the company?
I was happy to answer because I wanted to get ahead. So many questions how their product worked, what the tricky part of automatised currency exchange trading is, how the payments are handled. Stuff like that which I am just very interested in.
But, I did not get to ask all these questions. Instead, shortly after having asked these questions the guy gave me 5$ Starbucks gift card and thanked me for the interesting conversation. It was very obvious that the conversation was over. So, I walked away, happy about the gift card.
The opportunity cost of time
As a product manager you want to achieve one thing: sell more of your product. There are two ways to do that. One: reach more potential customer who don’t know about your product. Two: understand why customers are not buying and decrease those reasons in order to increase the likelihood of those who know about your product to buy. Side note: please also read these two pieces that matter here: win/loss analysis and product manager metrics.
The problem is that if you start selling a product, there will a large variety of different customers. Those customers will give you very different feedback depending on who they are and what they want. It is however impossible to serve all customers. That is why you need to disqualify customers in order to get the feedback that actually matters. That is also why feedback from your friends is irrelevant unless your target customer is like your friend.
Example: if you are in the business for handbags, you could be selling a Birkin bag or a basic tote bag. Obviously a birkin bag is a different product than a plain tote bag. Just putting a video here because apparently that is how the Birkin bag got famous.
Plus, if you watch the video here your time on my site increases and thats a KPI for me. Anyway, if you look at the simplified market for handbags it looks like the below.
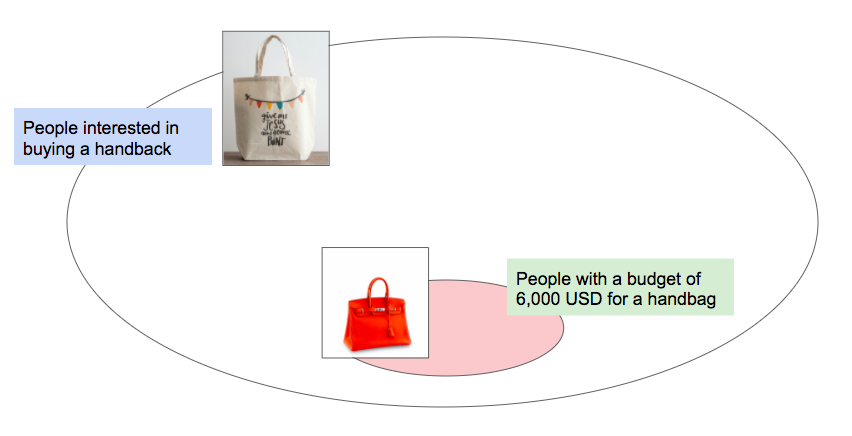
The market for handbags.
If you are selling Birkin bags, you do not care about the largest majority of the market. You are not interested in their feedback and you don’t want them near your store so that they don’t steal the time of those who could be selling to the proper audience. (Yes, I know maybe you actually want some of them in your store so that the people who buy feel special. That is a different point, I am simplifying).
As a product manager you therefore have a very clear incentive to disqualify rigorously. Otherwise any feedback you get has too much noise.
How to qualify
How one qualifies a potential customer obviously drastically depends on the product. For example, if you are a luxury store like Hermes you could put impressive looking people at the entrance. Maybe that will deter (= disqualify) anybody who does not feel the right to enter.
If you have a conversation with a customer you should ask for:
budget: how much are you willing to spend?
need: do you have a gala event coming up where you need a good handbag?
timeline: by when do you need a handbag?
authority: will you be buying this or is your wife the decider?
When there is no a sales team but the product is software driven, a qualified customer might be somebody who has used the product for a certain amount of time or any combination of these features. The goal remains the same: increase the likelihood of a customer to purchase by limiting the set of prospects to the ones that you want.
There is a wide ranging debate on how to qualify a potential customer, in fact, there is even a Wikipedia article on it: https://en.wikipedia.org/wiki/Qualified_prospect.
Disqualification for Product Managers - Conclusion
If your goal is to sell more product you need to understand a) how to win more potential customers and b) how to increase the chance of winning if a customer knows your product.
If you do that for any audience other than your target audience you product is becoming worse because you lose focus. The only way to ensure focus is to have a consistent disqualification of customers who do not fit your product.
Or, build a separate product for those customers - but then disqualify for that product as well.
Market Sizing - A Unit Economics Approach
The size of a market is a crucial input for management decision making. However, most approaches result in large but meaningless numbers. Here I provide a unit economics based approach to market sizing that provides much better insights. Recommended for (product) managers.
I have shared (similar) versions of this articles are also shared on LinkedIn and Medium
Market size estimations often feel arbitrary and pointless
Estimating a “Market Size” used to feel near pointless to me.

How big is the market?
Typically, a "bottom up" and a "top-down analysis" resulted in numbers like “5.2 — 7.4 Billion USD” for whatever the product in question is.
These kind of market size numbers are impossible to manage by, hold accountable for, improve or verify. They are useless numbers.
Market sizing is crucial for decision making
A lot of things are done badly. That’s ok if they are not important. But market sizing is very important. It is the key input for tactical management decisions for example: product investment, marketing goals, sales targets or engineering resource allocation.

GE/McKinsey matrix for market attractiveness
On a strategic level, a lot of management theory concerns the choice of markets. For example “new market disruption” theory points to delivering a product to previously underserved market.
Blue Ocean Strategy argues that creating new markets is the best way of escaping bloody competition in the current markets.
Obviously, both these approaches only make sense if the “new blue ocean market” or the “size of the underserved niche” are geared towards markets that are large enough. In other words — without a good market size estimations both theories are nice but pointless.
Sometimes the “market size” is not discussed openly or not an “official” part of the analysis. Make no mistake — whether the market size is an implicit assumptions or an explicit one it does not matter, it is still the key assumption.
The market size will re-appear at the latest when you fail to generate enough leads in that market or loose deals because there is no demand at a certain price/functionality point.
Market sizing done better: “reverse market sizing” based on unit economics
Core insight:
A market size without an assumption on the price of a product is not a market size. There is no market without price.

Market sizing for product managers - our example
This is the basic concept of what a market is. The price coordinates supply and demand, which leads to transaction (a.k.a. a product is sold) which makes a market.
Example: Component ordering software for independent car repair shops
Let’s say we are considering to build a business-to-business (b2b) software that allows independent car repair shops to compare parts from different suppliers and order them.
The problem this product solves is the time consuming research for the parts and the anxiety of not getting the right price.
Note: I made this up — now idea if this exists or is not possible for any particular reasons.
Now, what's the market size for this product?
Traditionally, the process would look like the below. Much simplified here to make the point.
Bottom-up analysis:
(number of cars in country) * (repairs per car per year) * (average cost of repair per car) * (cost of spare parts) = Big number 1 / bottom up analysis.
Then, you take a percentage of this value and assume that this is your market size.
Top-down analysis:
Find some statistics of the revenue of car repair shops. Make an assumptions on the margin through spare parts. Make an assumption on what you could gather from this. Big number 2 / top down analysis
Is this useful? Yes, this is probably useful to get the very basic statistics. But, it is certainly not meaningful, verifiable or allows us to set useful goals or evaluate the potential.
Reverse market share: ask a better question
A much more insightful way is to put put together basic unit economics of the product we are considering and reverse the market size question.
The question is not “how big is the market?” but “how big does the market for this product need to be to make the economics work?”
A much better question leads to a much more useful answer as we shall see below.
Let’s take the car part example again and do a reverse market sizing. We assume that we would be building a new product. The process would be similar for a new product.
Step 1: investment cost to build the offering for the chosen market
Do a rough and fast back of the envelope calculation of the costs. Components/ services/cost of developer time to build the offering that targets the chosen market.
Step 2: cost per unit of building, maintaining and selling the product
Cost per unit of making, selling and maintaining the product. One can have a detailed accounting based discussion of what falls into which category, e.g. Cost of Goods Sold vs. Overhead. The point here is make numbers you can use, thus I'd go with common sense. Don't overcomplicate.
Making one unit of product:
For example the cost of components and the internal or external engineering time (= cost) required to build it. Of course this depends on the product - in the case of hardware these might be physical components in the case of software components like AWS fees, mail-chimp email service or chat bot tools like intercom or whatever it is you are using. Per product sold - this is unit economics.
Selling the product:
Cost of acquiring a lead, how much time will you need to call or write personalised emails to your potential customers? Will you have a senior sales person with a roller deck of enterprise CIO's? What's the cost per click and the conversion assumption?
Again, this per product sold so you will need to make a number of assumptions.
Maintaining the product:
In case of software there will be an overlap here with the cost of making one unit since typically the components are on subscription. Account for the cost of customer support and other maintenance type costs here.
Step 3: set the price
As we discussed above, you will need to set a price now. Yes, this probably feels uncomfortable. Yes, this is difficult but without a price you are now building a market size. A market without a price does not exist, unless you are building freeware.
If you have no other starting point (competitor research, customer interviews) I’d take a 200% - 500% of your costs per unit sold (step 2). If this sounds high: remember you are pricing the value of your product, not the costs.
Step 4: Calculate your contribution margin
Easy: revenue per unit - cost per unit
A first version for our parts ordering software market sizing effort might look like the below.
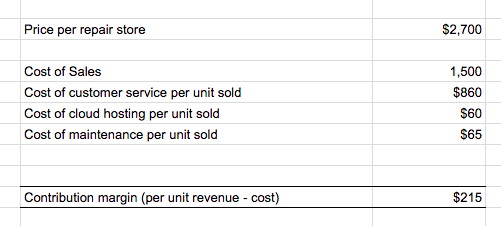
Unit Economics for Market Sizing - Back of the Envelope Example
In our example here the contribution margin is 215$ per unit sold, driven mostly be the Cost of Sales as we see from the numbers.
Since our development cost is 250,000$ we need to sell 250,00/215 = 1,163 units for break even. The math obviously very straightforward.
Compare these results to "The market is between 5.2 - 7.3 Billion USD". From my point of view they are dramatically more useful, because the key elements are clearly identified:
Price
Cost
Break even volume
Now we can verify and work on each element: what can product & marketing do to get the price of the product up? What can What can we do on the engineering side do to get the cost down? How can we reach customer cheaply?
Let's say, we identify that we can increase the price by 3.7% (which I am pretty sure you can always do)?
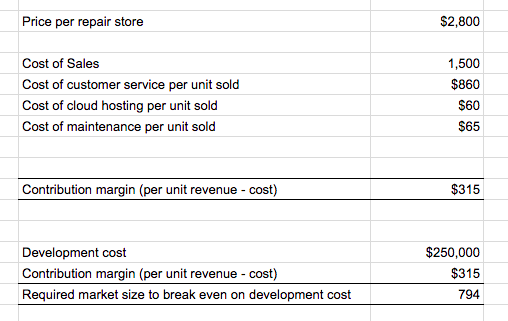
The effects of a small price increase on the break-even volume are dramatic
In this example, the effects are dramatic - a 3.7% (100$) increase in price leads to reduction of the break-even market size by 31.7% (794 units)!
Price is just one example of the numbers that become manageable. That's it for now, I leave you with a quote:
Unit economics based market sizing leads to real market size and actionable data.
Always interested in feedback, critique and question on the topic. I am at s.buenau@gmail.com

OKRs for Product Managers
Defining OKRs or Metrics for Product Managers is tricky. Based on the assumption that a product exists and the market is not yet saturated, this piece argues that product management OKRs should follow the funnel. In addition win/loss analysis as an OKR serves as a key business intelligence tool
Defining OKRs or KPIs for Product Management is difficult. Arguably, however good goals are important since product management teams can easily be drawn to the engineering side, the sales side or the marketing side and therefore need clear goals to prioritise actions.
Product Management goals depend on company stage
The first step is to clarify where you are in the product life cycle. In the following we assume that the team has a product in the market. In this case there are two options. Case 1: you want to sell more product to existing customers. Case 2: you want to sell the existing product to more customers.
Example: Let's say you are selling a tool to manage your suppliers. you might want to add an additional feature to handle supplier complaint management. If you plan to charge more for this additional feature than this would be case 1. You plan to sell more to existing customers.
An example of case 2 would be that you have so far focussed on selling the tool to car manufacturers in the UK. Now you want to sell the same tool to car manufacturer in Germany. This would be case 2.
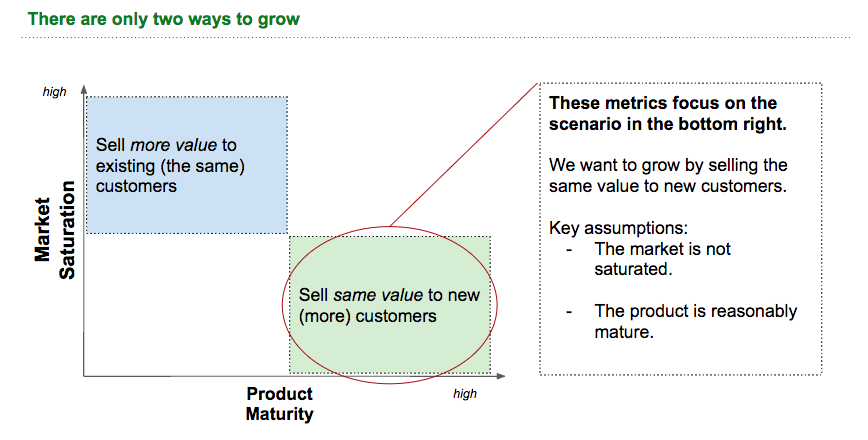
The two ways of growth
For the purpose of this article we focus on case 1. The key characteristics are: the product is mature but the market is not saturated. Whether these two assumptions are true will also be indicated in the metrics we are defining.
A good starting point on defining the size of the market is my article on Unit Economics for Market size estimations.
Product success is the indicator of good product management
Product Management teams have the goal to make a company successful by ensuring product success. Product success is unit sold. More precisely it is the contribution margin (= per unit revenue - per unit cost), however here we assume that the product is mature, i.e. a price is set and hence focus on units sold, not revenue.
But, we are not ignoring price - in fact whether we should decrease/increase the price is a key output of the metrics we are about to set.
In addition to the pricing element, the OKR system we are designing provides the source for key (company) management questions.
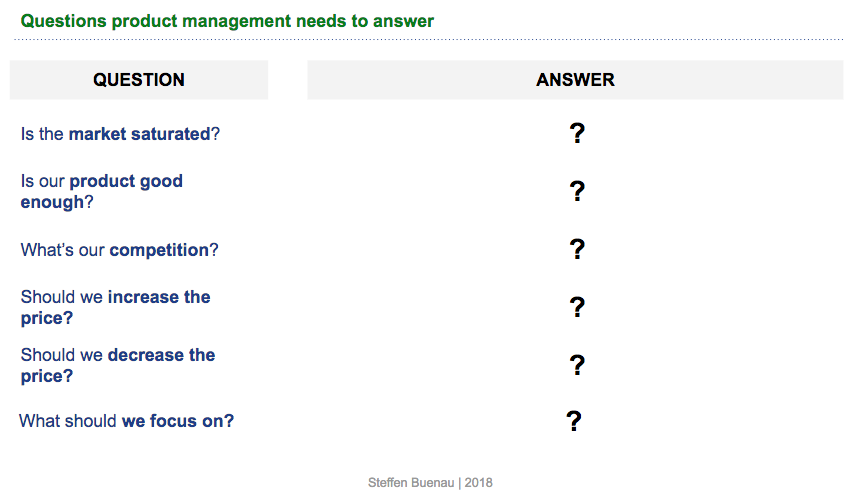
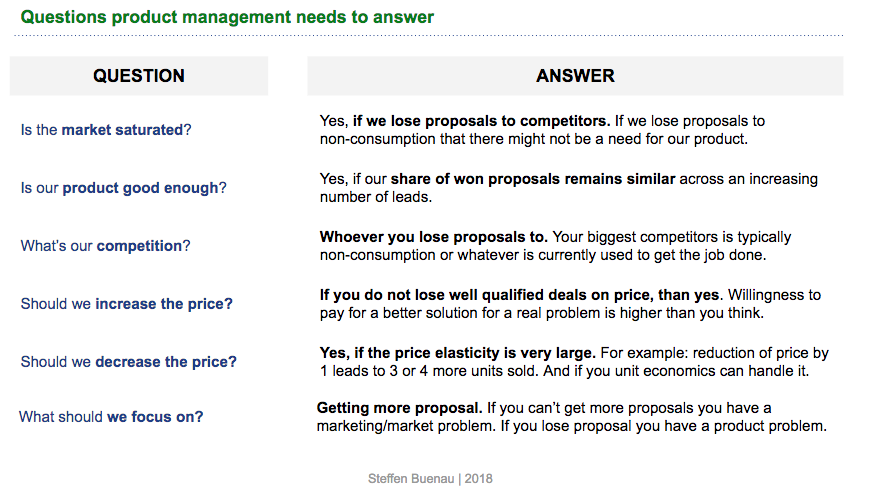
Good OKRs help us define the answer for these questions
OKRs for Product Managers need to follow the funnel
Since we have defined the context and the questions we need to answer we can now design the OKR system.
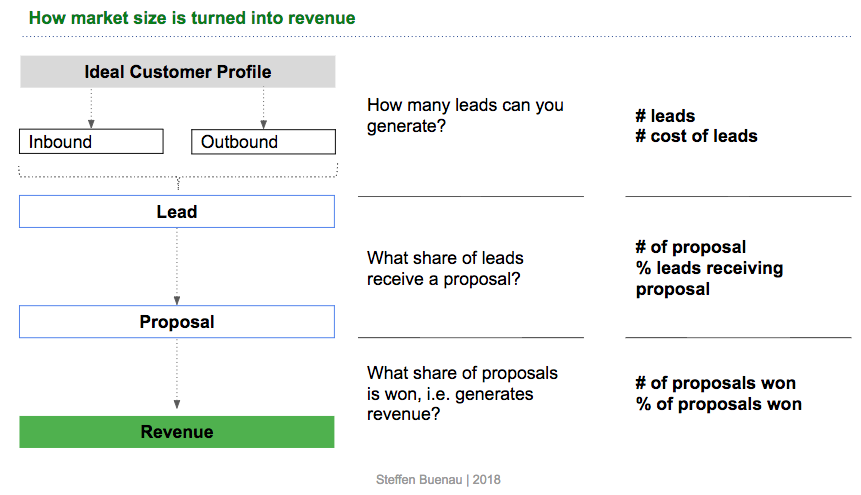
The rational is simple:
Unit sold (product success) come from proposals to potential customers. Specifically, units sold results from won proposals.
Proposals come from companies or people for whom the product could be relevant. These companies or people we call leads.
Leads are part of the ideal customer profile whom we have targeted either through outbound or inbound marketing activities. Outbound means we approach them first, for example through email or targeted advertisement. Inbound means they come to us, for example through product searches or referrals.
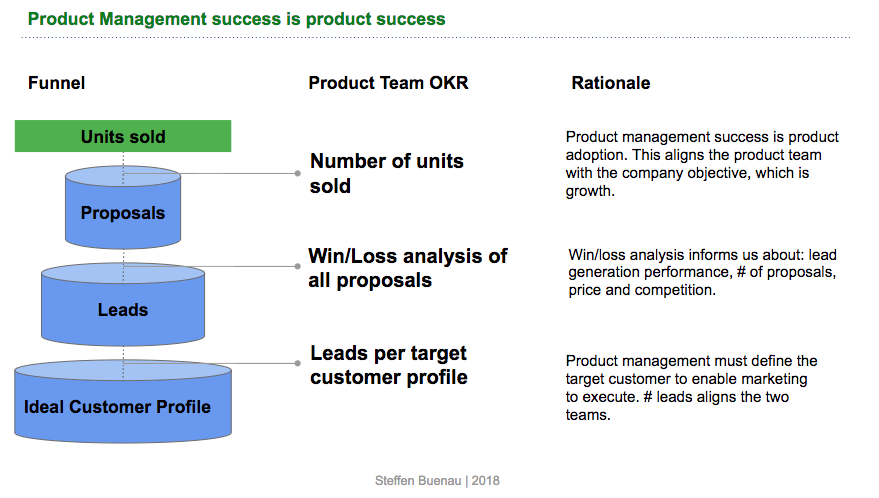
Product Management OKRs along the Sales Funnel
How to use the OKRs
OKRs along the sales funnel align the sales function and the marketing team but go beyond that into product specific insights through the incorporation of win/loss analysis.
The picture is simple:
Lead generation: product management is in charge of defining the target customer, price and features. In the assumed scenario this has already happend. Product teams now need to provide marketing with all that it needs to be able to reach the target customers effectively. These could be classic buyer persona's or things like useful content for the target market or participation in webinars. The problem is that this is not measurable.
Because we are need a measurable metric plus we do not want to measure activity but outcome the most relevant product OKR would be #of leads. Clearly, the execution and messaging is handled by marketing but two align the two teams in the interest of the company #leads is the most forceful tool.
Win/loss analysis: Since we assume a company set up with a Sales Team the conversion from lead to deal is carried by the Sales or the Sales Development Team. In other set-ups like in-app purchase business models these metrics could be carried by a revenue lead. I recommend to listen to the Episode "Revenue is Product Management" by the Mind the Product podcast.
A win/loss analysis will result in three key insights for the product team:
How many proposals do we have? If we do a win/loss analysis on all proposals we will automatically track the number of proposals that we have and understand from which customer profile they come from. This helps the product and the marketing team judge the effectiveness of particular marketing measures.
What share of proposals do we win and why? We care less about won proposals than we think. Generally, we want to know two things: are the won proposals enough to hit our overall volume goal, why did we win them and from which customer profile are they. The reason for winning we want to capture and use as part of our marketing message to the same customer profile.
From a pricing perspective, we want to understand if we could have sold the product to the same customer for a higher price.
What share of proposals do we loose and why? This is the most interesting insight for product management. Did we loose to a competitor or did the lead end up not buying anything for the job our product is meant to get done? If that's the case we might not be solving a problem that matters.
Did the customer not have a budget/means to purchase the good? Than we might need to change our target profile.
Did the customer chose a competitive product? If yes, this could mean the market is saturated or we are not doing a good enough job presenting our unique selling points or product advantages.
Did the customer not buy because of the price? If yes, why and how much lower would the price need to be for this segment of leads to win the proposal.
Beyond the product team - how do our OKRs help the company?
By following this metric or OKR structure we not only guide the product team on what is important: generating more leads that fit the profile, or winning more proposals we also deliver key insights to the management in general.
Based on the data resulting from the OKRs we can help the management answer the questions we posed above:
What is a company? A Product Management Perspective
The relationship between a product and a company is not obvious. Financial statements are rarely broken down into products and the ultimate drivers of the value of a product are not obvious for the overall company. I try to tie it together here.
Since I haven't studied business, my business knowledge is pieced together. For things like cost of capital, public and private equity, tradable vs. non-tradable debt or "alpha" the basic mechanics plus why they exist make sense. (Also the beauty and creativity of the concept of a legally limited entity is clear - e.g check out this piece)
But, it took me a long time to understand the relationship between product and company - from an operating business perspective. Not, for say a holding company.
An operating company generates revenue from the selling of products. That is why a product is the starting point and the unit of analysis to get to the core of it.
What is a product? Whatever has a price.
We define a product as what brings revenue to the company. For example, the product of Facebook is a click on an add. The product of a bank is the fee or interested charged on a loan.
A feature - in contrast to a product - does not have a price but is a characteristic of the product. For example, "groups" in Facebook might bring more people to Facebook or make them spend more time on Facebook which increases the odds of people clicking on a link. But, the number of groups on Facebook is irrelevant for it is not directly tied to the price per click Facebook charges it's advertisers.
A feature of a loan might be that repayment starts only after 5 years. If for example the loan is targeted at people starting a 5 year doctorate program. So that repayment start date is a feature, but does not directly change the revenue. (Yes, I understand time value of money but that is accounted for in the interest rate).
Another way of formulating what a product is, is (number of product) * (price) = revenue from that product. The product is whatever has a price and therefore generates revenue.
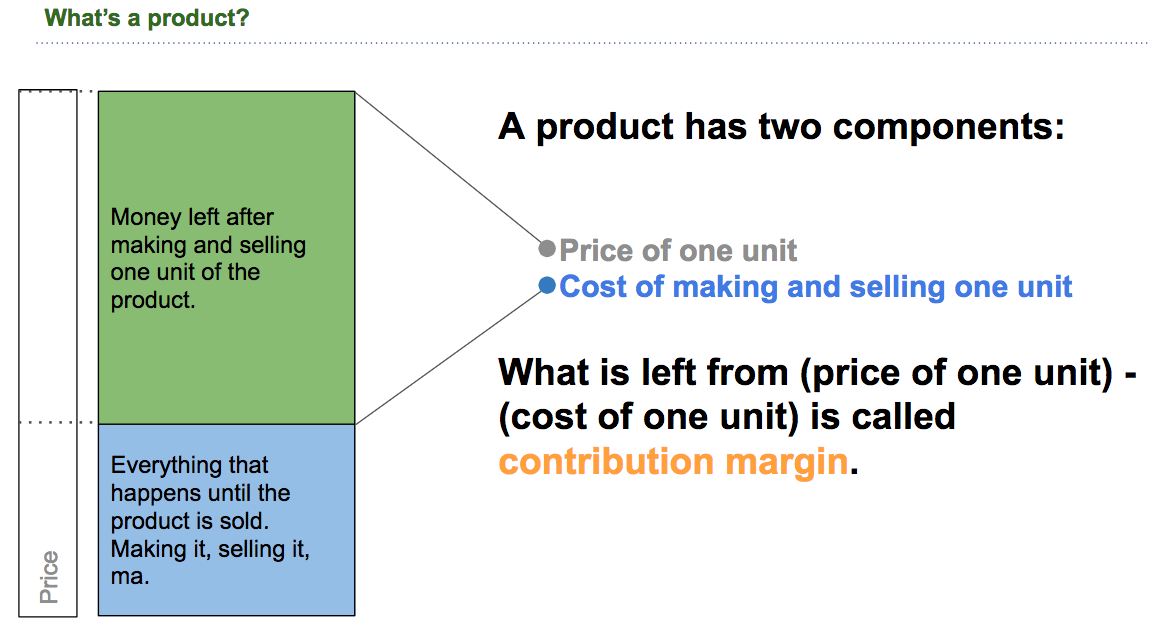
The two features of a product
Basic product costs...
Now, since the unit of analysis is the product we split costs between "costs per unit of product" and "overhead".
This obviously depends on what you are selling and how you sell it. For example, if you are McKinsey & Co. your product is a consulting contract. The costs are the salary of the people making the analysis and travel expenses. The cost of sales is maybe the membership of a partner in a high level working group, the golf club membership, travel and hosting expenses.

If you make iPhones, than the product is one phone. The costs are the components to make (< 400$ check out this analysis), and other cost associated with production and sales and marketing.
In our example above, if you are Facebook, the major cost is having the users that click on the advertisement (which is the product because it has the price money).
From an accounting perspective, this is akin to the variable costs. The logic of the variable costs is that they increase with additional output. So, if you build a car, than you got to buy 4 tires for every car. So the more cars you sell the more tires you need.
... and more tricky product costs
The accounting perspective on product cost is much more straightforward than it is in reality.
Say, you offer the customisation of a hardware product at a low price. The customisation price either exceeds the labour costs of doing it - than it is its own product.
If it does not than it is either "overhead" or "unit costs".
But which one - this depends on two questions: "Would you sell less units if this feature was not offered?" - if yes, than it is product costs and part of customer acquisition costs. If not, than it is overhead. If it is overhead, than this is part of company strategy either implicitly or explicitly.
A similar case are support and service teams - from experience we can see that the "does it increase units sold?" test often determines service quality. Either:
it has price, than it is a product
it increases volume sold - than it is part of customer acquisition costs
it is neither, than it is overhead
Products that operate in a low competition world - Internet, mobile phone, telephone - have low customer support/services. This is because having it will not drive units sold or would be an extremely expensive way of doing it. You need an internet connection. Once you have it you are in a long term contract so spending money on support is pointless.
The alternative is true for a company like Zappos. Retail depends heavily on customers buying repeatedly. Hence, every support interaction can be associated with volume increase, so it is a cost that drives volume sold and therefore accounted to the product in the customer acquisition cost bucket. A metric to use could be: "share of customers that order in 6 months after a support request" - compare this to the general re-order rate and you have a first meaningful piece of data.
Contribution margin
The difference between the price of a product and the cost of that product is the contribution margin. Revenue per unit of product - Cost per unit of product
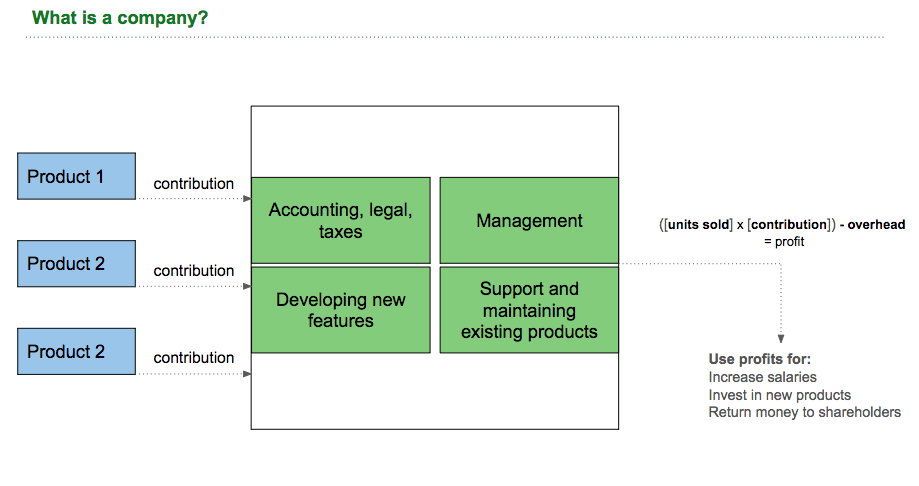
What is a company? The sum of its products
In this framework of analysis, a company is simply a collection of the products that it sells. For a company to exist, it either needs to be profitable or get funds by taking loans or selling parts of itself (= investors on board). In the short and medium term investors might sometimes care more about revenue or user growth than they care about profits - but in the long run profitability is king, because cash is.
That means, all the costs of a company that are not part of the product costs must be carried by the contribution that each product makes.

In other words: you have to pay everything that is not directly linked to a product from the contribution you get from other products.

The amount of money available simply is the contribution margin multiplied by the number of times you sell that product.
Given this scenario, two things become apparent. The goal of the overall management (on the left) and the goal of a product manager.
Product management: Increase the contribution
Given this approach to a company, the role of a product manager becomes relatively straight forward as well.
Essentially, increase the contribution of the product to the company. There are just three tools to do that:
increase the price,
decrease the costs
increase the volume sold.
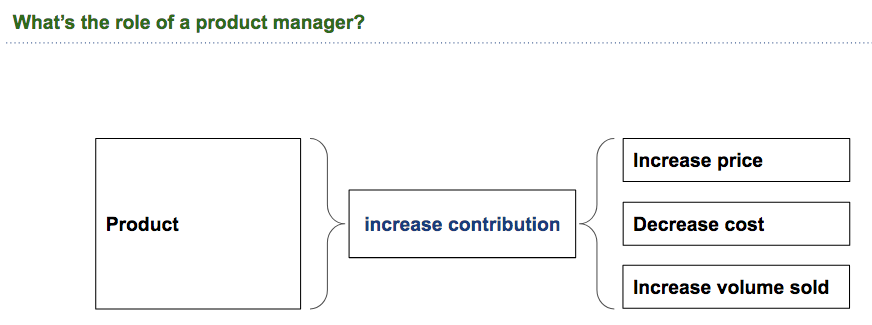
Product Management is increasing the contribution of the product to the company
(Besides discussions about launching a new product. Separate piece coming on that.)
In this light, a typical discussion, for example, if a certain feature is worth it can be discussed in a useful framework: Will it increase the volume? If so how?
By reducing lost deals? (how many do you loose right now because you don't have the feature?)
By bringing in new potential customers? (does marketing know?)
Hope this is useful!

Disruption theory applied: Bluetooth low energy vs. RFID
In this piece I use Michael Clayton's disruption theory to predict the future of the technology battle of Bluetooth Low Energy vs. active and passive RFID. The frame of analysis is the Jobs to done framework on a technology level.
This is an edited version of similar articles I have posted on LinkedIn and Medium previously. If you have read those than no need to re-read this one but I am happy if you share it.
The starting point for this piece was trying to apply disruption theory forward looking. Because, the strength of a theory is its ability to forecast the future.
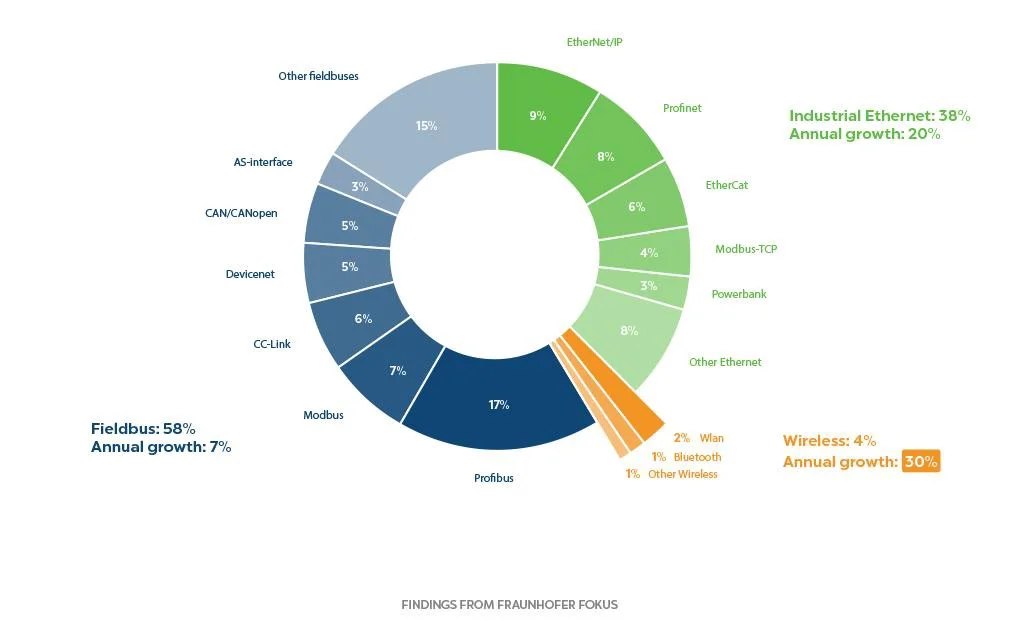
What is the internet of things?
At the core of the Internet of Things lies the challenge of getting information from sensors to the internet. The requirements for the underlying communication technologies vary widely on the common criteria of power consumption, latency, throughput, distance covered and resiliency.
However, one thing is clear: wireless technologies are leading the charge both in the retrofit market as well as the integrated market.
This article seeks to apply disruption theory to the competing connectivity technologies in the internet of things. I look at the competition between active RFID (typically the frequency bands 865–868 or 902–928 MHz) and Bluetooth Smart (or Bluetooth Low Energy) — both means of transferring information wirelessly. Active RFID has been around since the nineties, and Bluetooth Low Energy has been part of the Bluetooth Standard since 2010.
Conceptual frame: jobs to be done
The frame of analysis: jobs to be done
In order to frame the analysis appropriately, the realm of evaluation is described using a “jobs to be done” approach.
Job one: Knowing where things are at what time. Tags (for Bluetooth, these are often “beacons”) built on either technology send out a signal that allows the reader to estimate where the tag is. This is done by comparing the strength of a signal received with the strength of which it was sent out and using the difference to approximate distance. For example, if a tag is stuck on a forklift and the forklift enters an area with a receiver — say, a loading dock — the location of the forklift can be approximated.
Job two: Transmitting sensor data from a tag to the receiver. For example, a tag attached to a conveyer belt with a temperature and vibration sensor that transmits the information to a receiver. From this, valuable conclusions could be drawn: for example, whether the conveyer belt is overheating or running at an inappropriate time.
Different types of disruption
Disruptive technologies are divided into two: “low end disruption” and “new market disruption.”
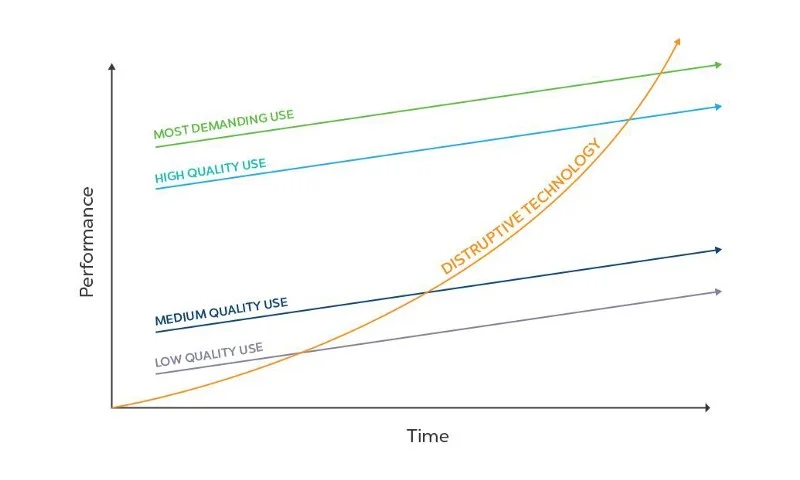
Different views on the disruption theory. Read: https://en.wikipedia.org/wiki/Disruptive_innovation
Low end disruptions work in a similar pattern. The initial entry point is a group of underserved customers, typically at a low price point that makes these customers unattractive for incumbents. That is why these customers are typically underserved in the first place.
Then, as the technology continuously improves, it moves to more complex and higher value applications replacing the incumbents. Classic Clay Christensen examples include the Mini-Steel Mill or the Digital Synthesiser. The same effect Mahatma Gandhi describes in “first they ignore you, then they laugh at you, then they fight you, then you win.”
Since RFID and other technologies which do comparable or similar jobs to Bluetooth Low Energy and have been around for quite some time, this is not “new market disruption.” For the sake of argument, we’ll exclude the technological advancement of a wireless technology working natively with the ubiquitous smartphone.
Does Bluetooth Low Energy fit the low-end disruption theory?
As the Disruption Theory suggests, initially Bluetooth Low Energy served customers that have not been served by incumbent technologies. Indoor wayfinding is possible with RFID tags and dedicated handsets. Consumer applications like Bluetooth key fobs are similarly functionally possible with existing solutions. But both are on the bottom of technology applications and not profitable.
The key question is whether Bluetooth Low Energy will move up the performance stack and endanger incumbent technologies, in this case active RFID.
Job to be done 1: Location
Arguably, the current performance of active RFID and Bluetooth Low Energy is relatively similar. The question is whether and if Bluetooth Low Energy will improve significantly and move up the stack. Today, from a technological perspective, this seems very likely for the following reasons:
First, integrating additional sensors like acceleration and inertia at a low battery cost will enable much better contextual interpretation of the Bluetooth signal, resulting in higher functional accuracy.
Second, Bluetooth 5 is mesh ready which means that the cost of receiver nodes drastically drops. The mechanism is this: Bluetooth nodes can act as both a receiver and a broadcaster of a signal. As the cost of Bluetooth hardware is extremely low given the economies of scale of the smartphone supply chain, it is possible to find affordable (sub-50 USD) battery powered receivers capable of forwarding information to a central hub via mesh networks.
Job to be done 2: Sensor data
Transferring information from a sensor to a receiver is a commodity job. In the large majority of use cases, latency requirements and throughput volumes are low. Bluetooth Low Energy boasts a convenient entry point due to the low costs of the sending device. This is accentuated by its integration into smart phones.
First of all, this means that data retrieval from sensors can be handled through smartphones without the need of an external infrastructure, further reducing costs.
Second, lower energy consumption per data volume transferred increases the potential for sensors.
Finally, sensor information and location information can be easily combined in use cases where the receivers are mobile devices.
Starting at the low-end, will BLE move up the stack?
Right now, there is no question that Bluetooth is still far from the advanced industrial solutions offered by RFID across verticals and specialised use cases.
The key question is: why should Bluetooth Low Energy not move up the stack and disrupt the incumbents? Given the affordability, capability and growing popularity, the only unknown factor for Bluetooth’s disruption in the Industrial IoT is time.
About me: formerly core technology lead, now a strategic advisor to Kontakt.io. In the past, I have worn many hats including growth manager, advisor, and board member.

Product Strategy for Machine Learning
Specifically written for product managers, this article is designed to give a useful framework for thinking about machine learning and artificial intelligence.
It isn’t obvious that adding to the plethora of existing material on machine learning is worth the readers or the writers time. The focus of this piece is the product strategist, meaning: he team or individual tasked with allocating within or among products to drive market share, revenue, profitability, growth, or whatever feeds the companies strategy.
It is divided into three parts. First, a closer look at what machine learning or AI really does - namely what a prediction is. Secondly, we consider the options for implementing machine learning in light versions, such as prioritizing which sales lead should be contacted first to full-on implementations such as self driving cars. Third and lastly we take a look at the key aspects of data.
What does machine learning do? A closer look at what a predictions is.
A deceptively simple answer to the question what machine learning does is: “it improves prediction making”. This, of course, is meaningless unless we understand “improving” and “prediction”.
What is a Prediction
Predicting over time
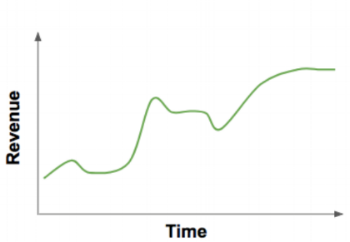
The word prediction can be a bit tricky because of the way it is usually used. A typical prediction that a product managers comes across would be revenue over time.
A “revenue forecast” is nothing but a prediction over time. Revenue could also be predicted among other dimensions, say by product, in any case both are just predictions.
Now, let’s change what is at the axis. Let’s say we are predicting whether or not something is a hot dog or is not a hot dog.
The input for this specific prediction is a picture.
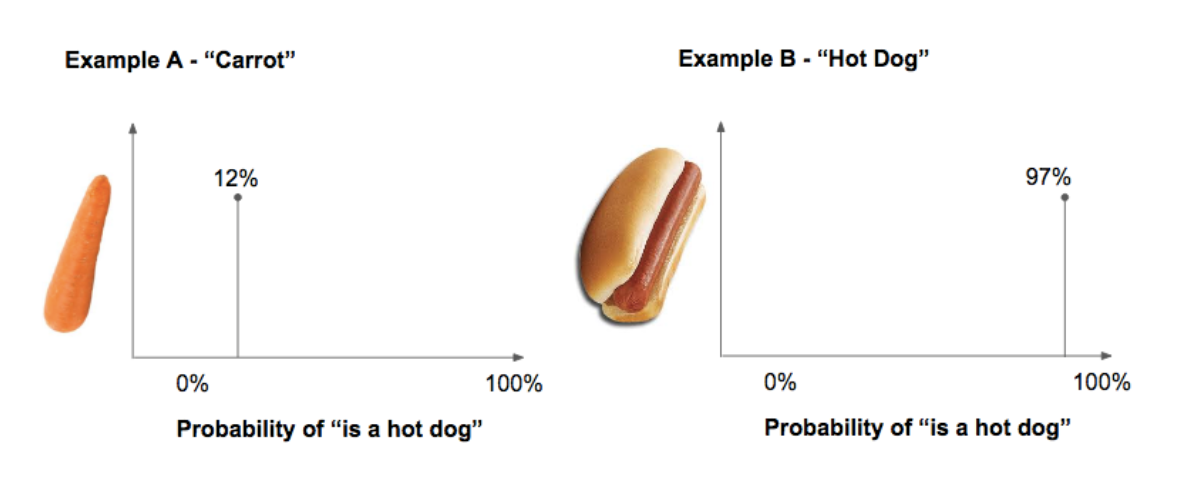
If we look at the X axis, we see that the unit is the probability of the object “is a hot dog”.
Of course, for a human it is easy to differentiate between pictures because humans just happen to be very good at getting and interpreting visual data. In other words, we can see things and know what they are.
But, if you (or any other human) were asked to make the same prediction to give me this information:

It would be much harder for us to predict which of the lines here represent a hot dog. That is just to say, different data can be used to predict the same thing, the probability of whether something “is a hot dog”. Now, back to the picture example.
“Improving” decision making
As a human, when looking at the picture of a carrot and a hot dog, we just recognize which one is which.
But, if I wanted to try to write a program that predicts whether something is a hot dog we might approach it like this: First define a range of typical colours of a frankfurter. Second we define a range of typical colours of bread. Then we define, whenever the ratio of “frankfurter pixels” divided by “bread pixels” is 45% - 75% then the probability that this is a hot dog is 100%.
Now, it is probably obvious that this is highly impractical given the varieties of pictures with hot dogs. Plus, it requires knowledge and an decision-making of how the different factors weigh in.
Machine Learning uses a different approach: after providing a set of correct predictions, pictures labeled as hot dogs (called training data), the computer considers all the factors it finds and weighs them by which factors are most useful in predicting which object is a hot dog and which one is not. This has three consequences:
First, much more and much more complex factors can be processed by a computer than by a human.
Second, we do not know (or more correctly, it is very difficult to re-trace) what the algorithm uses to make it’s prediction. The algorithm might have used our “bread pixels” to “frankfurter pixels” or it might not.
Third, it can be much faster and much cheaper to build a good prediction machine compared to a human. This however depends on the prediction in question and the available data.
How to make a feature out of machine learning? Basic options for implementation.
Machine Learning is about making a prediction. Yet, a prediction has zero value without action resulting from that prediction. How the prediction is taken into action is a separate step. There are different ways of segmenting or thinking about the action part.
Option 1: Offer suggestion to the human
For example, let’s look at CRM system. A CRM is basically a list of potential customers. It is key decision whom the sales representative calls first. A sales representative might only get to make 10 calls per day, so who get these calls matters greatly. Now, let’s say we have trained our prediction machine so it reliably outputs which customer is most likely to buy.
The CRM system might offer the sales representative “10 suggestions” of whom to call each day. These suggestions are simply the predictions of the lead that have the highest likelihood to buy.
Yet the point is, the human still take it’s own decision and can therefore use information that is not captured in the CRM. Say, the sales representative had just been at a conference where he met a potential customer that was very eager to buy. So the sales representative might overrule the machine.
Option 2: Define the workflow
For the second option, let’s assume we have build a workout app. Our goal is to make sure that our users finish the 90 day fitness course. Of course, we want to push our users so that they see results of their workouts. But, we also know that there is a risk of users ending the app use altogether.
Let’s say, we can build a prediction machine on how likely our user is to stop using the app. Data included could for example be how long the user takes per exercise, at what time of the day the workouts happen or a form of user feedback such a question “how exhausted are you on a scale from 1-10”.
Based on the prediction we could than moderate the fitness program for the next day. We could make the app include less of the hardest exercises and instead add some more enjoyable elements. In other words, the human still takes the action but has, in comparison to the first case, no choice in the matter.
Option 3: Let the computer take action
In the most extreme case both the prediction and the action are handled by a machine without a human interfering. The obvious example is a self driving car - it combines prediction and execution. In such an autonomous car there are massive amounts of predictions happening simultaneously - “is the road going left or right?”, “is the child walking on the sidewalk or is it running onto the street?” with relatively few outputs, acceleration, braking and steering, also taken by the machine.
While this is a well known scenario, It’s useful to look at a simpler case. Let’s say we have build a prediction machine for football betting. Following a prediction the machine can bet. Yet, that is not the end: how much can the machine bet? How certain must the probability be to bet how much? Who, at the end, is responsible for the money that could be lost.
In this example the context is only money - these questions which include responsibility get more tricky in other context. Medical diagnoses or the above mentioned autonomous car. Going deeper into these questions far exceeds this piece.
However, allow me one comment - when comparing different solutions it might be useful to be clear about what the ultimate objective if. Or, to be drastic, what is better: 3,500 annual deaths from cars driven by humans or 200 annual deaths from car driven by machines? Note, that I am not arguing that the number of deaths is even the ultimate objective, maybe it is human agency or something else. Clarity about what is being predicted and who takes action is necessary to discuss these questions productively.
How to fuel the machine? Considerations for dataset valuation
When somebody is “doing machine learning” they are not defining how a machine learns but they are teaching a machine that already knows how to learn. That is, because actually enabling machines to learn is a both highly abstract (really difficult) and is software and thereby has virtually zero marginal costs.
Or, take the business perspective: you will not be able to build machine learning algorithms because the talent is extremely rare. And even if you were, you would will not be able to make money because you don’t have the scale to sell them.
Thankfully, machine learning algorithms are widely available in different formats from free libraries to hosted cloud platforms that combine providing, running and storing the algorithm - AWS, Google, Azure and others.
What most “doing machine learning” usually means is gathering, preparing and using data such that you are able to a) generate predictions that are better than the current alternative and b) have ways to let the appropriate action by executed which reduces costs or risk or, even better increases revenue.
There are two sets of data that are vital to the success of this operation. Success means that your prediction is better than what’s currently being done and that the quality of the prediction continues to improve.
Training data - This contains the data you want the prediction machine to use, plus the correct result. For example, if we were to train our hot dog vs. carott prediction machine we might generate source hundreds of pictures and crowdsource the labelling. Mechanical turk is a common tool for this. In the case of picture labelling this is of course quite straight forward because most people know what a hot dog is. That is different for other training - if you think back to the case of the CRM system you would need to have a number of leads with their characteristics plus whether they have bought something in a given time frame or not. That might be difficult data to get.
Feedback data - The second component is feedback data. Not only do you want to train your prediction machine but you want to prevent it from getting worse. This means you need to capture the results of the action which were based on your prediction. Think back to the Fitness App - did the action taken by the app really reduce the likelihood of a user stopping its usage? To judge this you need to know whether a user actually stopped. Or, in other words, you do not want the outcome to “leak”.
The big picture on product strategy for machine learning
Besides the buzz and the speed at which machine learning topics move, the process for the or product strategist can be broken down into a relatively simple questions to ask yourself in the given case:
What is the exact outcome I am predicing?
What is the gained value of the right prediction and what is the lost value of the right prediction?
How will the prediction be translated into action?
With the dataset I have right now, can I predict noticeably better than whatever is doing the prediction today?
What is my path to even better predictions? How will the feedback from actions be incorporated?
If you do not have clear answers to the questions 1-3 you need to get back to basic product management - understand workflows and understand the economics of you user by talking to your users. The machine learning canvas is a good tool to do that. I
f the answer to question 4) is “no”, than you have a data problem. Question 5) should get you thinking about the future of your product on a more strategic level.
Recommended Resources
Hopefully this article gives you an overview to ask good questions to dive deeper, for example "how exactly mathematically does this work?", what is the difference between "machine learning and artificial intelligence"? Without having that question it is difficult to read well. Anyway, below is a set of pieces I want to give respect to for they have helped me.
https://medium.com/machine-learning-for-humans
http://investorfieldguide.com/ash/
https://www.amazon.com/Prediction-Machines-Economics-Artificial-Intelligence/dp/1633695670
https://medium.com/louis-dorard/from-data-to-ai-with-the-machine-learning-canvas-part-i-d171b867b047
https://a16z.com/2017/03/17/machine-learning-startups-data-saas/

Pricing and Discounting - Introduction for Product Managers
Pricing is extremely important but has many 2nd and 3rd order effects that were not obvious to me. Summarising what I learned about pricing and unit economics from a product management perspective in this post.
It appears that price reductions and discounts are often done without a clear understanding of the goal. Of course, as consumers we see discounts nearly every day from clothing, to plane tickets and other products. But, this does not explain if and when discounts makes sense and when they don’t.
In this post, I am will go through an example both of potential goals as well as do the math on whether a price discounts is the right tool to approach that goal.
From a strategic perspective there are 5 potential goals:
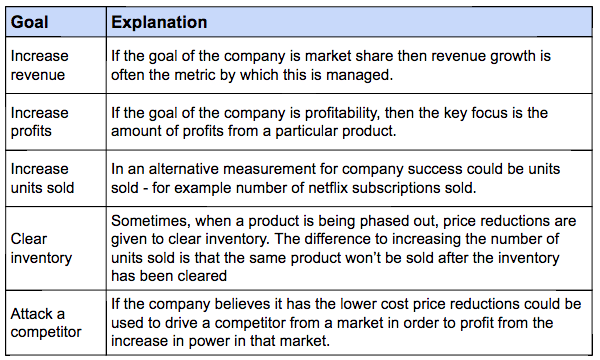
Strategic reasons to drop a product price temporarily

This is a football net.
To make these clearer we will be working with an example. I'll be using a company that sells footballs. I think everybody know what those are.
Also, football nets will play a role. Football nets are those things you can carry balls in. See picture.
If you are interested in the excel from which I am taking screenshots, you find that here.
Example Set-Up
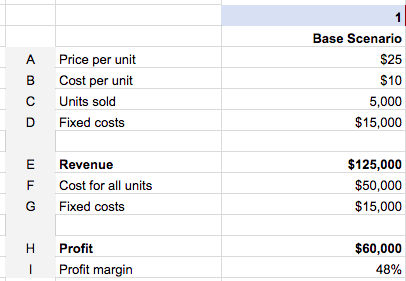
Price per unit: The price a customer pays for one ball
Cost per unit: The cost of making the ball, shipping it to the customer, with packaging, shipping and everything else associated with one ball.
Units sold: Number of units sold
Fixed costs: Costs associated not with selling one ball but with the business in general, like the rent of the office or the tax advisors. This does not change with the number of footballs sold.
Revenue: That is simply (price per unit) x (units sold). In this case: 25$ x 5,000
Costs for all units: (costs per unit) x (units sold). In this case: 10$ x 5,000
Fixed costs: Explained above, so in this case $15,000
Profit: Revenue - fixed costs - costs for all units. So in this case: 125,000$ - 50,000$ - 15,000$
Profit margin: (profit)/(revenue). So in this case: $60,000 / 125,000 = 48%
Goal 1: Reduce prices to increase revenue
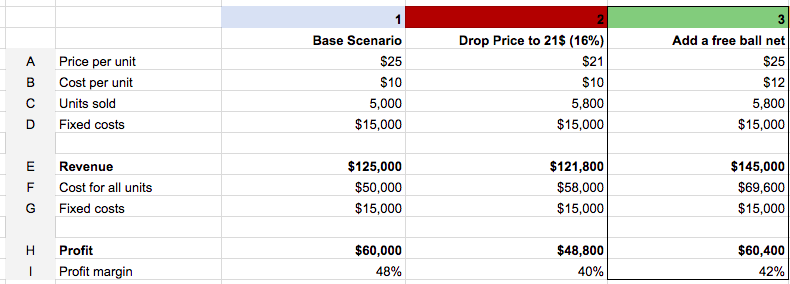
The question is this: if we decrease the price by 16% and our demand increases by 16% does our revenue increase? (Yes potentially there could be an increase in demand higher than 16% - check out the excel to model that yourself). Let's look at the numbers.
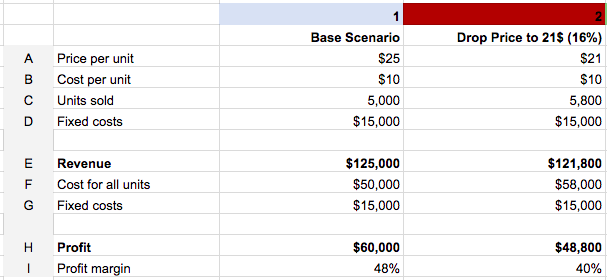
First, we drop the price from 25 or 21 USD, that is line A. This is a 16% drop (4/25 = 0.16). Now, let’s increase the demand by 16%. Our new number of units sold is 5,000 x 1.16 = 5,800 units, which you find in line C.
This just means: our price dropped by 16%. Our volume increased by 16%. What are the effects:
Revenue: decreased from $125,000 to $121,000. We have not achieved our goal of increasing revenue because revenue has dropped.
In addition, we have eliminated $60,000 - $48,800 = $11,200 in profits. That is also not good but does not concern us strategically because we want to grow revenue and not profits.
First conclusion: if we drop price by 16% and demand increase by 16% we don't achieve our goal of increasing revenue and we also loose profits. You can do the math based on the excel linked above, in short - you would need an increase of demand by 20% in exchange for a drop in price by 16% to increase your revenues.
Goal 1 - Increase revenue. Additional considerations.
Besides the simple numbers we have just done, there are other consideration when looking at decreasing price to increase revenue. Let’s go through a couple of them.
Price discounts only work for customers you lose because of the price
If you make 100 sales pitches per month, have 100 people visit your website or have 100 people come into your store - a price discount does not increase this number per se. If only affects the sales pitches you make and which you lose on price.
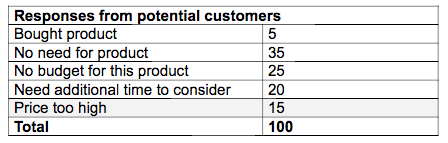
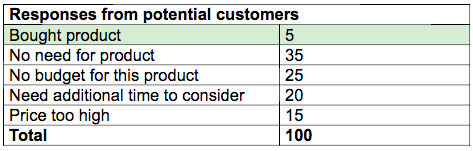
Simplified win/loss analysis results to understand what pricing drives
If this is the split of the results of your 100 pitches, you can only expect an effect on those 15 pitches that are lost on price. That is the number marked grey in this table.
Without massive advertisement (which has a cost) you will not increase your revenue through a decrease in price. In other words: if you do not reach your customer, a price of 0 does not change the number of customers you reach.
Combining this with the above: the 16% increase in units sold we assumed above does not just happen. It still needs advertisement. Most important customer need to know what the price is in order to buy because of a lower price.
Alternative: spend the money to generate more leads
If we need to spend money to broadcast our message of lower prices. We could also spend the money on increasing without lowering the prices. In other words – increase the number marked yellow.
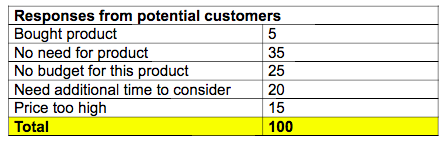
Why not spend the money you spend anyway without dropping the price?
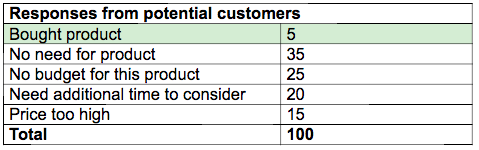
Alternative: spend the number on training/improving sales
Another alternative use of the cash you will spend on telling people that you dropped prices is to spend it on the conversion rate. You could spend the money on inviting all your existing customers to lunch to understand why they bought. You could hire a store assistant or spend the money on training your sales team or update their tools and systems. Or you spend the money on new packaging so that the potential customers you do have understand the benefits and are persuaded to buy.
In other words, change the number in green by improving your sales game.
What if price is not actually the reason why you loose business?
In short: first understand the reason why customers are not buying. If that is the price, there a discount might help. If it is not the price, a discount won’t help and you might end up only loosing money.
Goal 1: Give something for free instead of decreasing the price
An alternative to dropping the price is adding something for free. For example, if you are selling footballs you might add a free ball net.
For example, The Economist is currently adding a free USB stick. Certainly not because the average Economist reader does not have the money for a USB stick.

What about something for free instead of a cheaper price?
But why is this a good alternative? There are obvious strategic reasons – you do not train your customers to expect discounts. You can add variety to your campaigns by adding different stuff but discounts are just discounts. As an idea, you could add an hour of “free consulting” from your CEO/Product Manager/Head of Sales and so actually learn more from your customers.
Of course, this “soft stuff” is not enough. Let’s look at the example numbers. Our goal is still the same: to increase revenue.
What happens when you give something for free?
Our price stays the same, $25 (Line A). Our costs increase by $2 because we have to buy the ball net (Line B). We assume that our units sold go up by 16% because our customers really like the ball net. That assumption is basically on the same level as assuming demand increases by 16% if you drop the price by 16% - both need to be tested. Let’s look at the effect:
Revenue: revenue is up. We have achieved our primary goal!
Profits: Increased by $400 as well. Our profit margin is a bit lower but since we are looking for market share, not profitability that is alright.
This alternative of giving something for free seems to be much more appealing than dropping the price! Of course, it hinges on the % increase of orders but it is not obvious that people like free stuff less compared to reduced price.
Goal 1 - Summary
First, understand why customers are not buying. Second, consider adding a free gift but keeping the price.
Goal 2 – Increase units sold
Now, our goal is to increase the number of units sold. This is only different from revenue because sometimes this is a better reflection of the stage of your company.
For example, for Uber the number of signed up drivers might be the key metric because it is an indicator of market power. Similarly, netflix regularly reports the number of subscribers as a key metric. The assumption probably is that once you have the customer subscribed you will turn a profit at some point.
In these scenarios a table like the above makes less sense because you have to take into account the available capital. Business like Uber and Netflix are able to raise the money to finance the growth even at a per unit loss because the monetisation is assumed to be possible
A meaningful way to think about this is not the revenue calculations we did above but understand the reasons why customers are not buying.
If we look at the same table as before, we see a 5 people actually buy the product out of 100 we pitched.
Why uber and netflix don't care about prices
So, in a business where the potential base is extremely large (like becoming an Uber driver or subscribing to Netflix) you likely focus on the other reasons why customers are not buying.
Your whole focus is the customer acquisition and the price is only a small part of this. A bigger problem is getting everybody to know about Netflix rather than lowering the price. That’s probably why Netflix initially did not care about customers using the accounts of their friends. In general the problem is not the price of netflix, especially when customers get older, but that everybody needs to know about it.
Unfortunately, your market is probably to small to justify this strategy.
Goal 3 – Clear inventory
A case in which price discounts do often make sense is clearing inventory. Inventory can be seats on a plane that flies anyway, empty hotel rooms at the end of a day or clothing from the previous season. While the cost of clothing obviously does not go to Zero, it is looked at in comparison to the new season stuff. At the end of the Winter season, it is cheaper for H&M to drop the price drastically for customers to buy it rather than the alternative. The alternative would be to throw away the stuff to clear the retail space for new season stuff which does have a higher price.
The difference to the example given at the beginning is that the “marginal costs” are close to 0.
The equivalent would be where the next football does not cost $10 but maybe $0.5. That would mean you are turning a profit whenever you sell higher than $0.5. Typical examples:
plane seats (the plane is flying anyway)
hotel rooms (hotel is built and rooms are equipped)
clothing from last seasons (the space needs to be freed up to for the next seasons)
Goal 4 – Increase Profits
As we have seen above it is quite difficult to increase revenue through price reductions. Increasing profits is even harder because profits are: (price) x (units sold) – (units sold) x (cost per unit) – fixed costs = profits.
If you are dropping price you first need to sell more to get to the same revenue. Next, because the difference between price and costs per unit has been decreased you need to sell an extra amount more to increase your profits.
What you need to increase profits through reduced prices
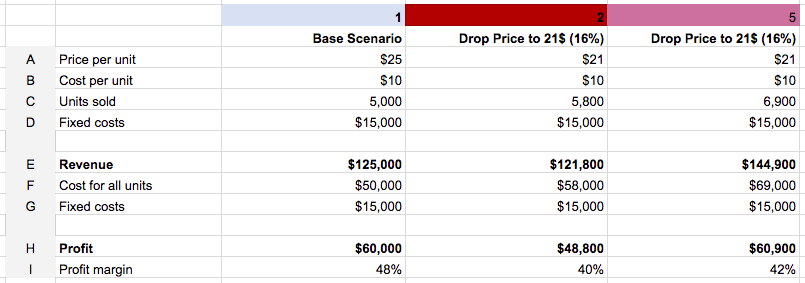
Blue (Column 1) is our base scenario. Red (Column 2) is what we looked at before. Violet (Column 5) is what we look at now.
The question is: if we drop the price by 16% (row A) by how much does the demand need to increase in order for profits (row H).
I have played around with the demand figure until I got the profits above $60,000.
The answer is: for a discount of 16% sales need to grow by 38% for the profits to increase. That is massive increase in demand, possible but unlikely.
I would claim that unless your whole reason of being is to cut costs, like Ryanair or Aldi it is extremely difficult to grow your profits through cost leadership.
Goal 5 - Attack a competitor
Included for the sake of completeness - I don’t know much about this so I will not comment deeply.
Only one thought: if you drop prices - the opponent either follows this move or does not follow.
If the opponent follows by also by reducing pricing, you want to make sure that they leave the market. Because if not, you might just end up with the same market at lower prices. That would the worst outcome.
Now, if your competitor does not follow but stays in the market with a higher price point and you don’t win over customer from the competitor you know that the problem is not the price. It is the product.
Summary
Unless you are clearing inventory, price reductions rarely work. Re-visit the goal you want to achieve and consider the alternatives.

Semi-rogue guide how to start a product management career
On the occasion of giving another lecture on product / product strategy earlier this week, I am also summing up super tactical tipps to find a product management job. This is pro-active stuff which is fun and will teach much more than just reading.
A number of "how to get a product management job" content exists and I don't intend to make another version of that. Instead, is my personal approach that is a bit more rogue for people really interested in stuff, not only how to find a job. If you do want the other type of material, start with good product manager, bad product manager.
If you are interested in a bit of rogue action, this will take you about half a day on a weekend and be a lot of fund and very interesting. Basically, what I have done in variations at different points.
Now, simply because this blog post looks stupid without further text I am adding some copy here. Among other things (relevant when you read the slides), it might be good to know that publishing a blogpost like this takes about 3 minutes on the technical side but much, much longer on the writing side. It is actually the creative work that takes the time, not the technical.
Anyway, please enjoy the slides and tell me if they are helpful or not.